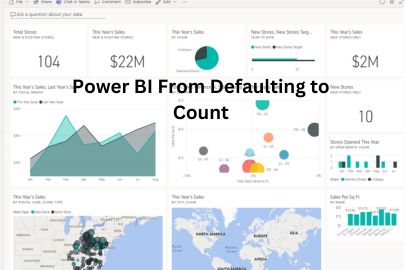
Power BI is one of the most adaptable and potent technologies available in the field of data analytics. It has become an essential tool for analysts and business professionals alike due to its capacity to turn unstructured data into useful representations. Even seasoned Power BI users, nevertheless, could struggle with an unpleasant default behavior, the automated counting of data. Today, we’ll dig into the nuances of Power BI’s Count capabilities and demonstrate how to stop Power BI from defaulting to Count in order to recover control over your data.
The Default Behavior
Picture this scenario: you have recently loaded a dataset into Power BI and are eager to produce some amazing representations. You expect to get a straightforward depiction of your data when you drag and drop a column into your canvas. Instead, a count-displaying chart greets you, leaving you wondering, “Why is Power BI doing this?”
Power BI uses this automated counting behavior to present a fast and practical summary of your data. Power BI assumes that you want to count the instances of each distinct value in a field when you add it to a graphic. While this may occasionally be helpful, it may not always be what you need, and it may cause confusion and incorrect data interpretation.
The Importance Of Understanding Power BI Count Functions
You need to have a solid understanding of Power BI Count functions in order to recover control over your data in that tool. These operations—which are at the core of automated counting behavior—are what cause those erroneous counts to appear in your visuals.
The primary Power BI Count functions are:
1. COUNT:
Using this method, you may easily count the number of columns or rows in a table.
2. COUNTA:
A column’s non-empty cell count is calculated using COUNTA.
3. COUNTBLANK:
This function counts how many cells in a column are empty, as the name would imply.
4. COUNTROWS:
Depending on the filter context, COUNTROWS is used to determine the number of rows in a table.
5. DISTINCTCOUNT:
The DISTINCTCOUNT function counts the amount of distinct values in a column, which is frequently what you need when making visualizations.
6. SUMMARIZE:
SUMMARIZE is crucial for building custom computations and aggregations in Power BI, while not being a counting function in and of itself.
You can take control of your data and make sure your graphics appropriately depict the insights you want to express by understanding how these functions function and when to apply them.
How To Stop Power BI From Defaulting to Count
Now that you understand the significance of Power BI Count functions, let’s examine several practical steps to stop Power BI from defaulting to Count:
1. Choose The Right Visual:
Choosing the right visual type for your data is the first step. Different graphics have various predefined actions. For instance, whereas a bar chart could by default show a count, a table graphic will show raw data. You may frequently completely eliminate the automated counting behavior by selecting the appropriate graphic.
2. Use the Fields Pane:
When it comes to modifying what displays on your visuals, Power BI’s Fields pane is your best friend. You are able to specifically choose the aggregate technique by dragging and dropping fields into the Values section of the Fields pane. If you wish to display sales revenue, for instance, drag the “Sales” field to the Values section and choose “Sum” rather than “Count.”
3. Create Measures:
Custom calculations known as measures in Power BI let you specify exactly how you want your data to be aggregated. You may override the counting behavior that is used by default and show the data in a way that is most appropriate for your research by adding measures. Measures are very helpful when doing intricate computations or aggregations.
4. Modify Field Properties:
To modify a field’s default aggregate, you can change its attributes. To use the “Default Summarization” feature, right-click a field in the Fields pane, choose “Field properties,” and then click OK. The aggregate technique of your choice may then be selected from there.
5. Use DAX Functions:
You may build unique computations and aggregations using the robust formula language known as Data Analysis Expressions (DAX) in Power BI. You may carefully manage how your data is summarized in your visualizations by creating DAX expressions.
Practical Examples
Let’s look at a real-world scenario to see how to prevent Power BI from defaulting to Count. Consider that you have a dataset with sales data. You want to make a visualization that displays the overall sales revenue broken down by product category. Here’s how you can do it:
- Move the “Product Category” field to the bar chart’s axis area.
- Drag the “Sales Amount” field into the Fields pane’s Values section.
- In the Values section, click the arrow next to “Sales Amount” to bring up a drop-down menu, and choose “Sum” rather than “Count.”
- With no needless counting, you now have a bar chart that appropriately depicts the entire sales income by product category.
Although Power BI is a very potent tool for data analysis and visualization, its default counting behavior occasionally interferes with your analytical objectives. You can recover control of your data and make sure that your graphics appropriately represent the insights you want to offer by learning Power BI Count functions and following the step-by-step instructions provided in this blog article. Don’t settle for defaults when Power BI gives a variety of tools and choices to modify your graphics. Instead, make your analysis fit your unique requirements. You can fully utilize the capabilities of Power BI and advance your data analysis with the correct skills and expertise.
Also Read: 10 Right CRM Metrics for Your Business


